
As a new service in 2024, we will be providing a complete list of monthly market statistics for El Paso County and/or particular zip codes. If you’re interested in receiving this monthly stat report, please email [email protected]
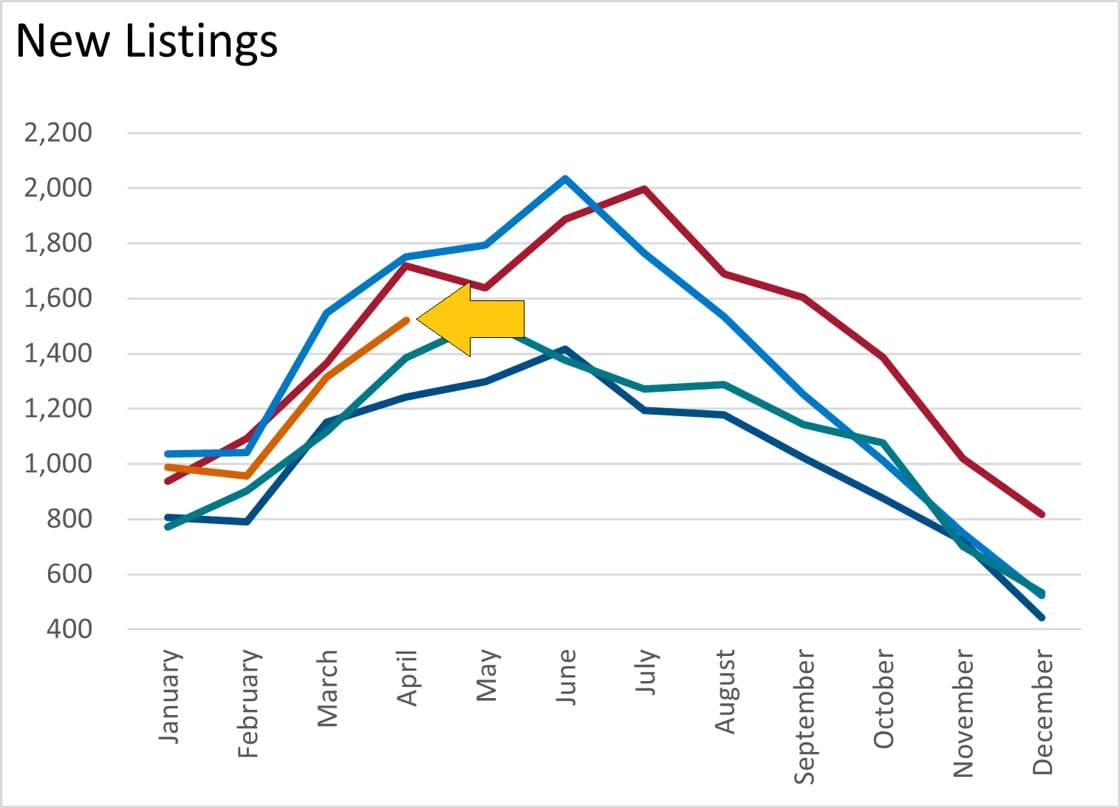
The El Paso County real estate market saw 2,737 active listings, with 1,522 new listings and 836 pending sales. When compared to last year, new listings were up by 9.9%, with pending sales decreasing by 3%. Pending sales also saw a 7.5% decline when viewed month-over-month.
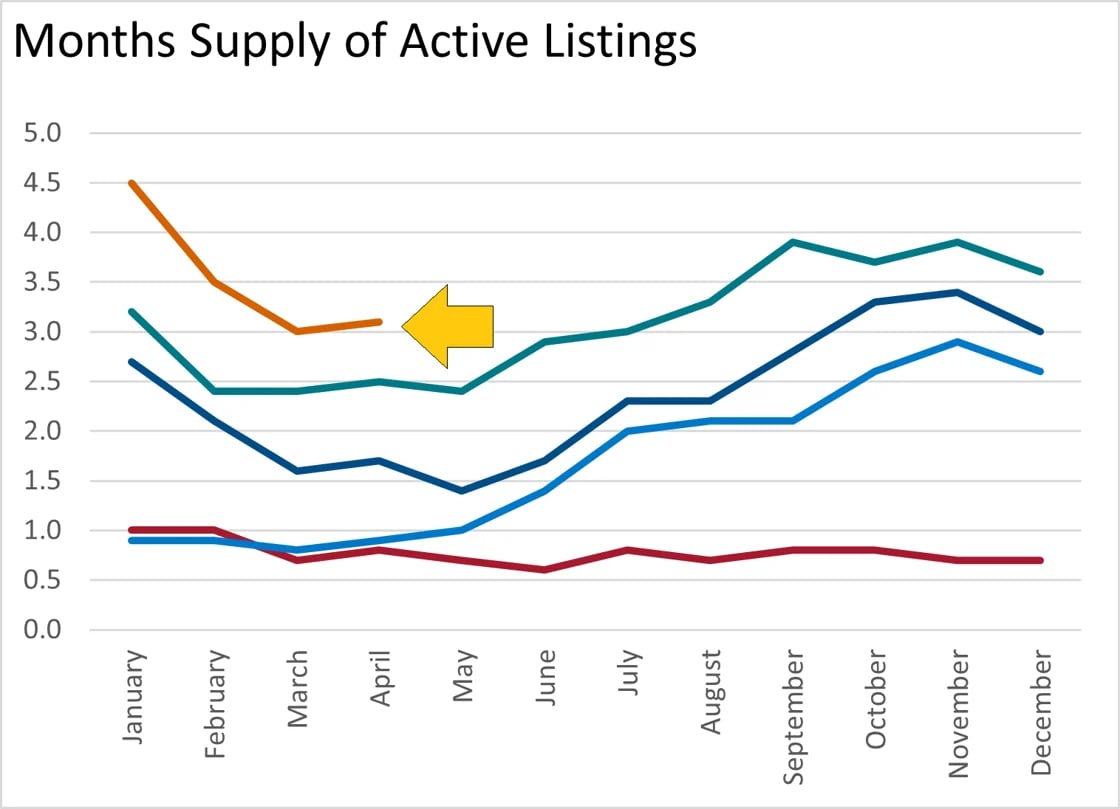
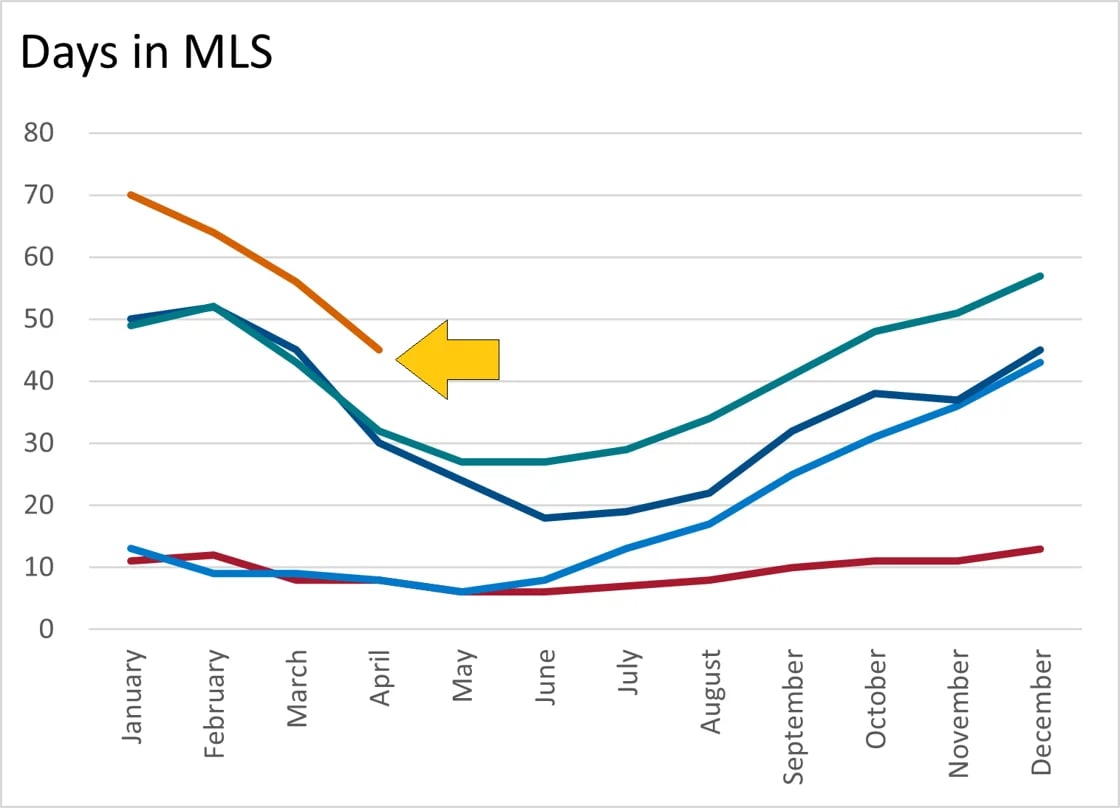
The months supply of inventory landed at 3.1 months, a 24% increase year-over-year. Days on market climbed to 45 days, on average, a 40.6% increase YoY.
Prices for single-family/patio homes saw increases across both average prices and median prices both YoY and MoM.
Key highlights are below.
If you are interested in subscribing to another market, click the link below to see a full list of the First to Know reports we offer.
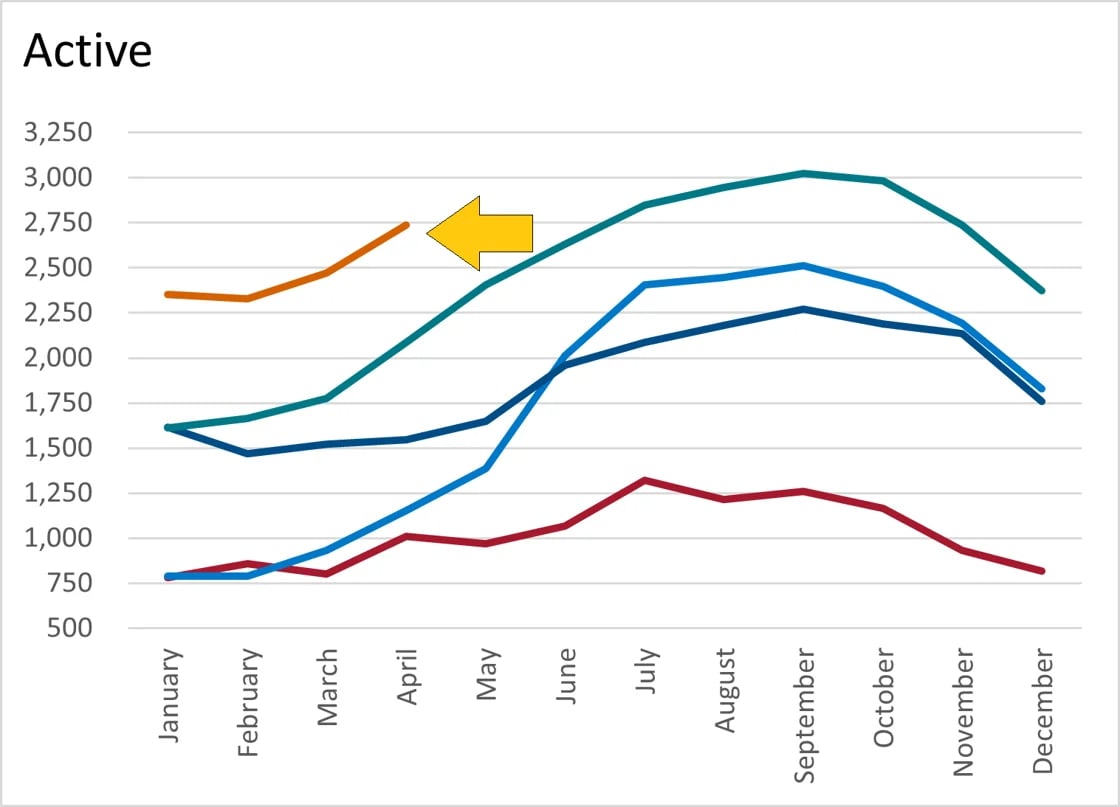
Active listings were up 10.8% when compared to last month and jumped 31.1% when compared to last year at this time. Last year saw 2,087 active listings.
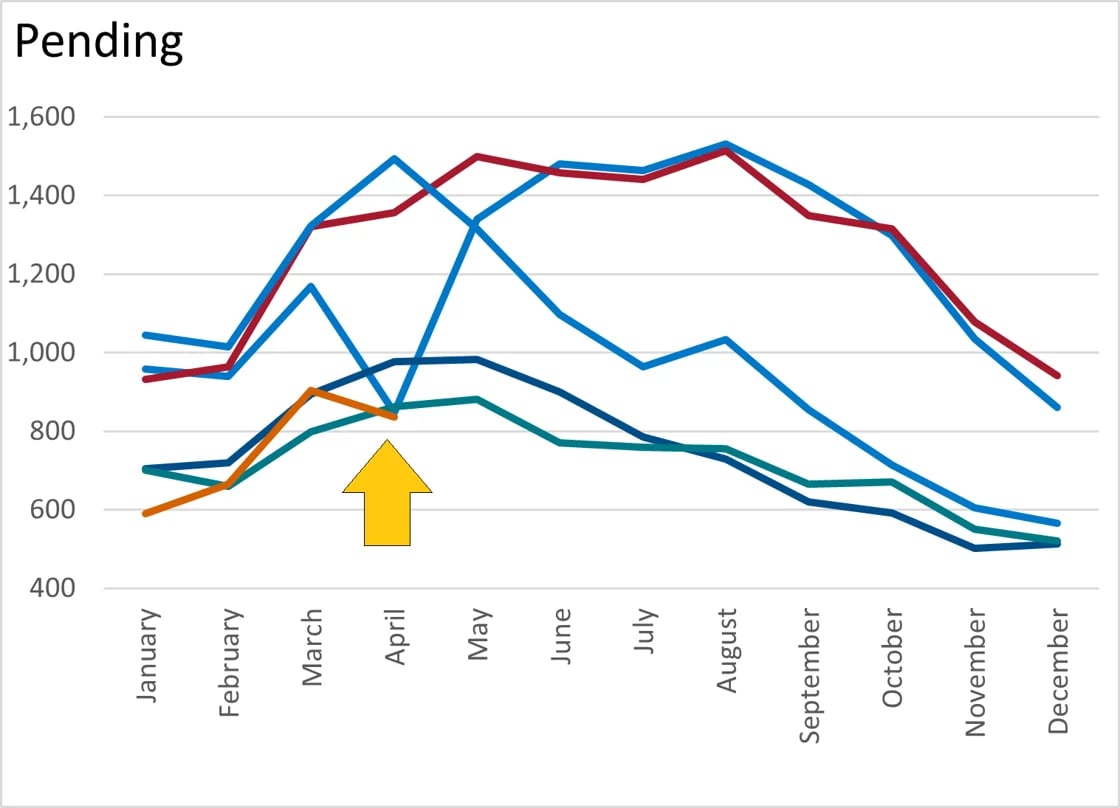
Pending properties - indicating demand - were down 7.5% MoM and saw a decrease of 3.1% when compared to last year at this time. Last year saw 863 pending sales.
April saw a 3.3% increase in inventory when compared to last month.
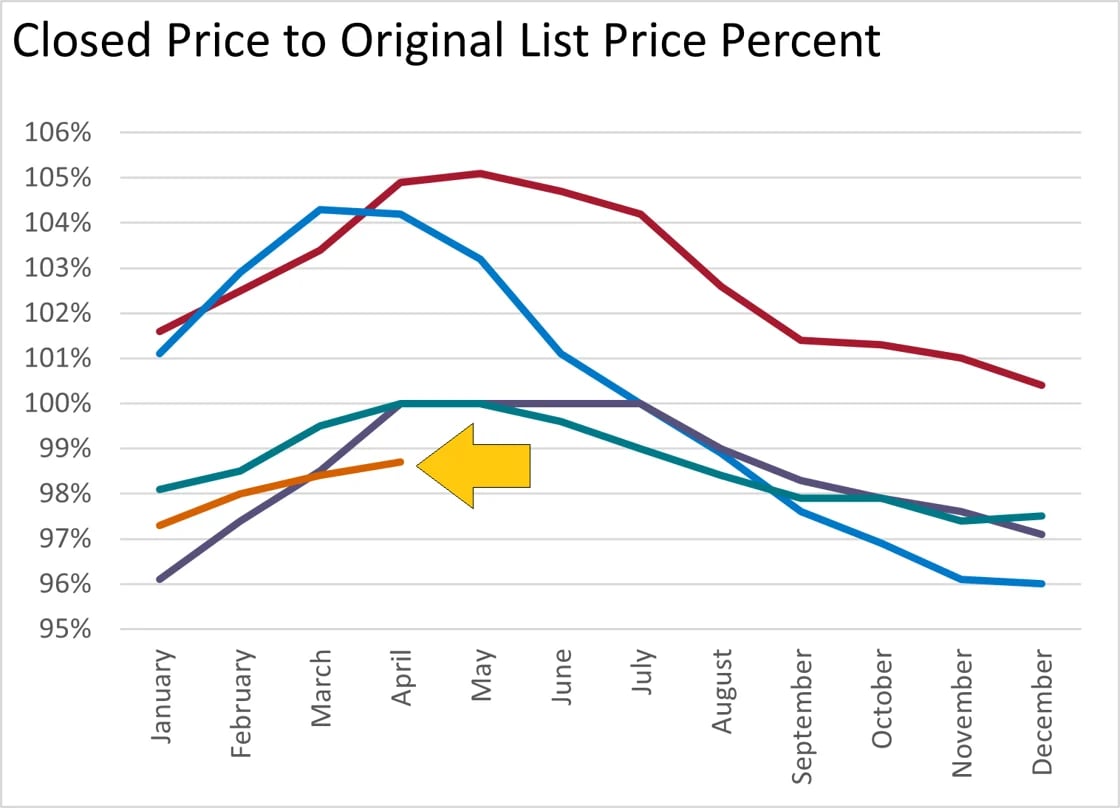
April saw the percent-of-the-closed-price-to-list-price at 98.7%.This data point was up MoM (0.3%) but down 1.3% compared to last year.

This data point was up 1.1% when compared to this time last year, and up slightly (0.4%) when viewed month-over-month.
If you would like to have our monthly stats for your zip code, please email [email protected]. Stats are released on the 15th of each month. If you would like to be taken off further mailings in area code 80919, email [email protected] with the subject: Remove from Mailing list. We understand that most of you have agents or are not in the market to sell.
With our extensive knowledge and commitment to providing only the best and most timely information to our clients, we are your go-to source for real estate industry insight and advice. Buying or selling a home is more than just a transaction: it’s a life-changing experience. Feel free to contact us for all your real estate needs.